Table Melt
Description
Used to convert short, wide data tables into long, narrow data tables. Selected columns are transposed, with the column names converted into values across multiple rows.
Perhaps the easiest example to understand is to think of a data table with months listed as column headers:
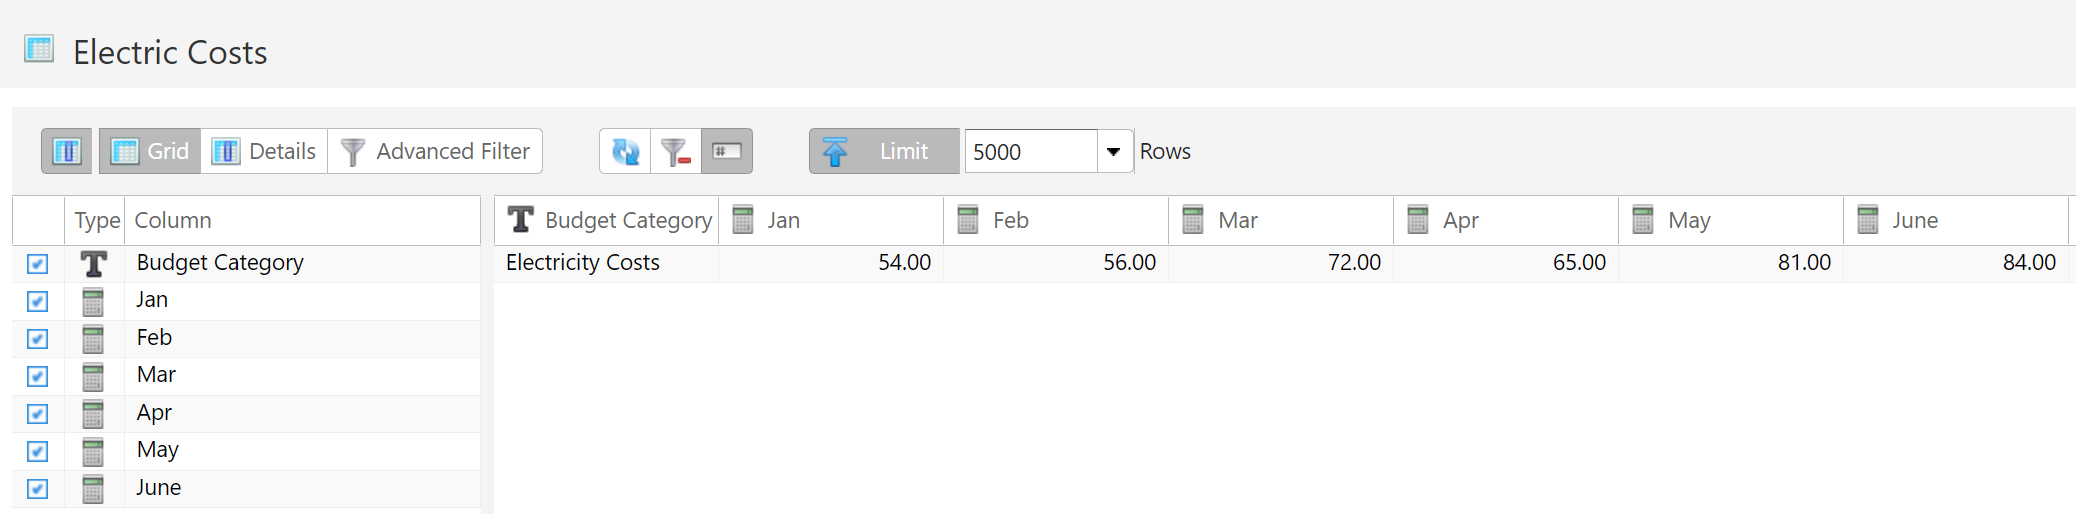
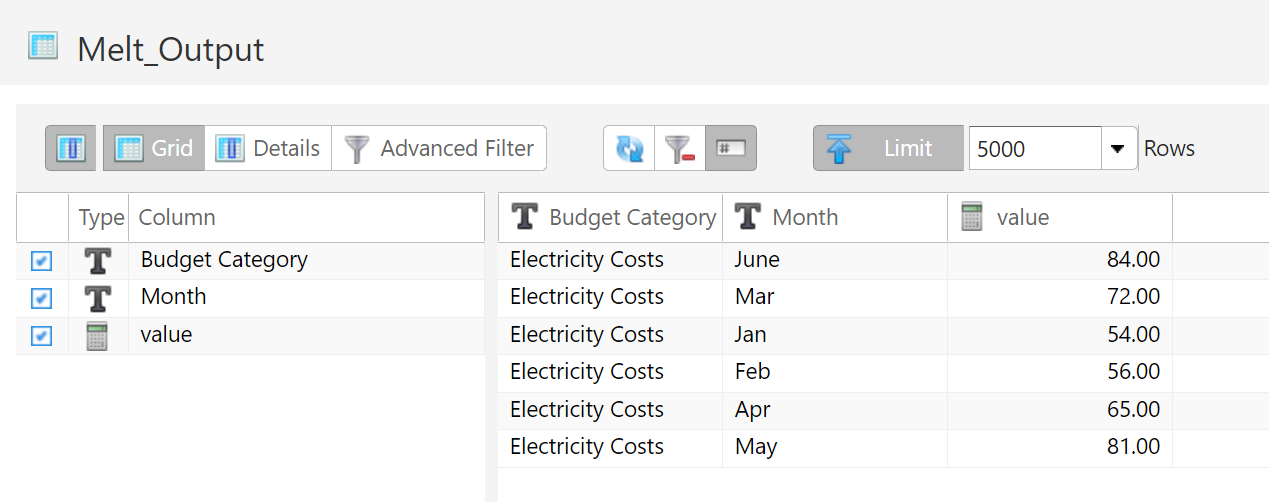
Melting this data table would convert all of the month columns into rows.
By specifying which columns to transpose and which columns to leave alone, this becomes a powerful tool. Making this conversion in other ETL tools could require a dozen more steps.
Source and Target Parameters
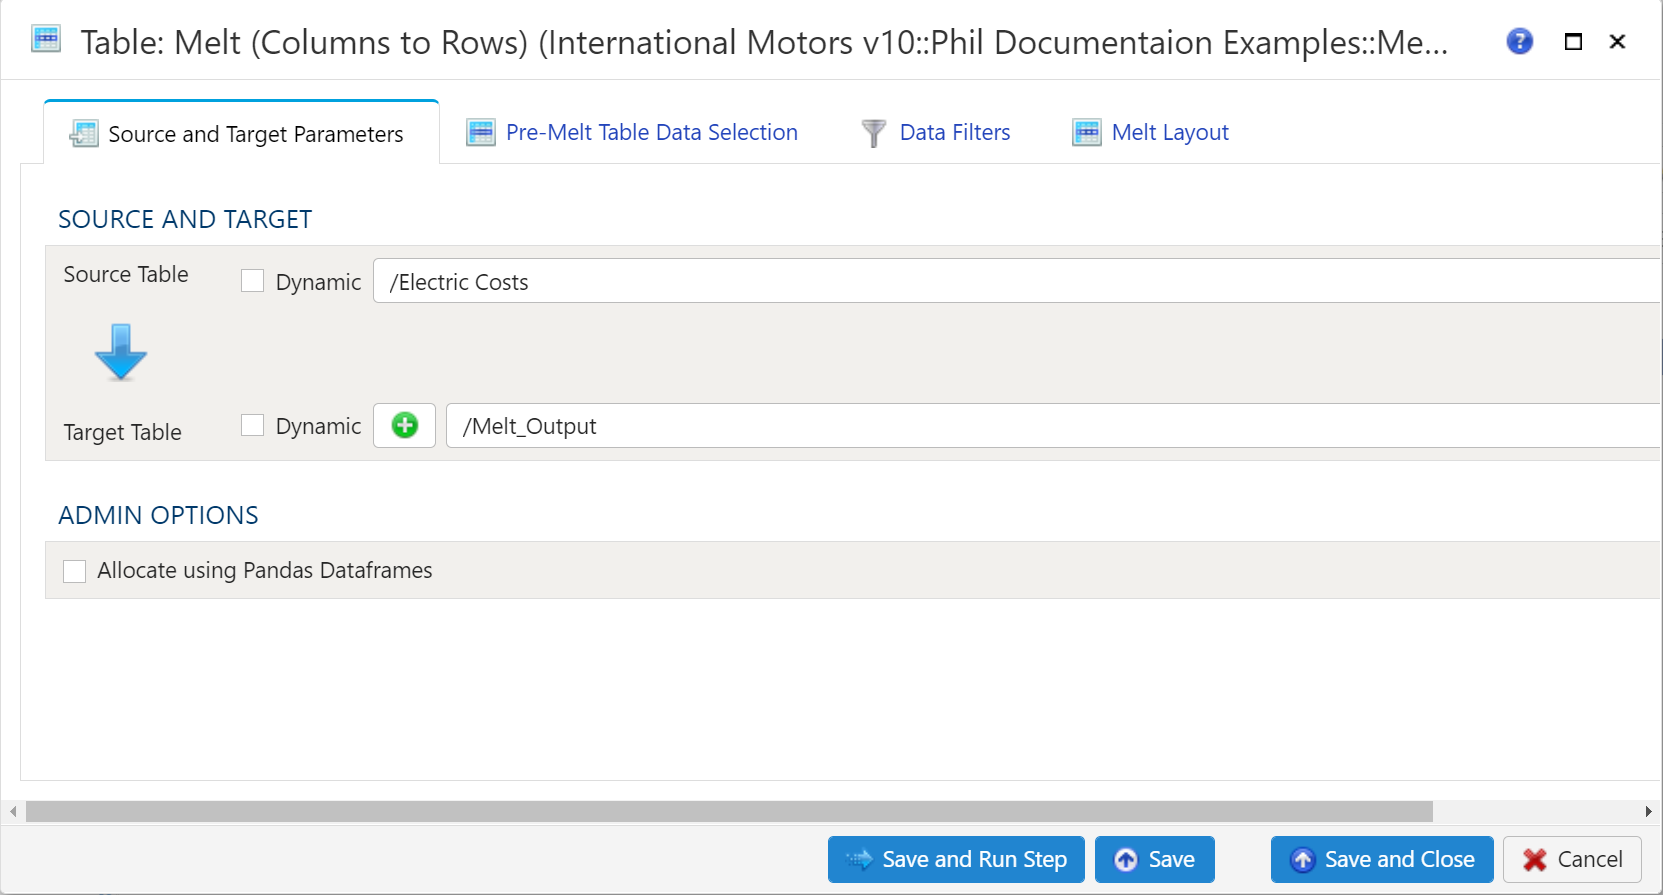
Source and Target
To establish the source and target, first select the data table to be extracted from the Source Table dropdown menu.
Target Table

To establish the target table select either an existing table as the target table using the Target Table dropdown or click on the green "+" sign to create a new table as the target.
Table Creation
When creating a new table you will have the option to either create it as a View or as a Table.
Views:
Views are useful in that the time required for a step to execute is significantly less than when a table is used. The downside of views is they are not a useful for data exploration in the table Details mode.
Tables:
When using a table as the target a step will take longer to execute but data exploration in the Details mode is much quicker than with a view.
Pre-Melt Table Data Selection
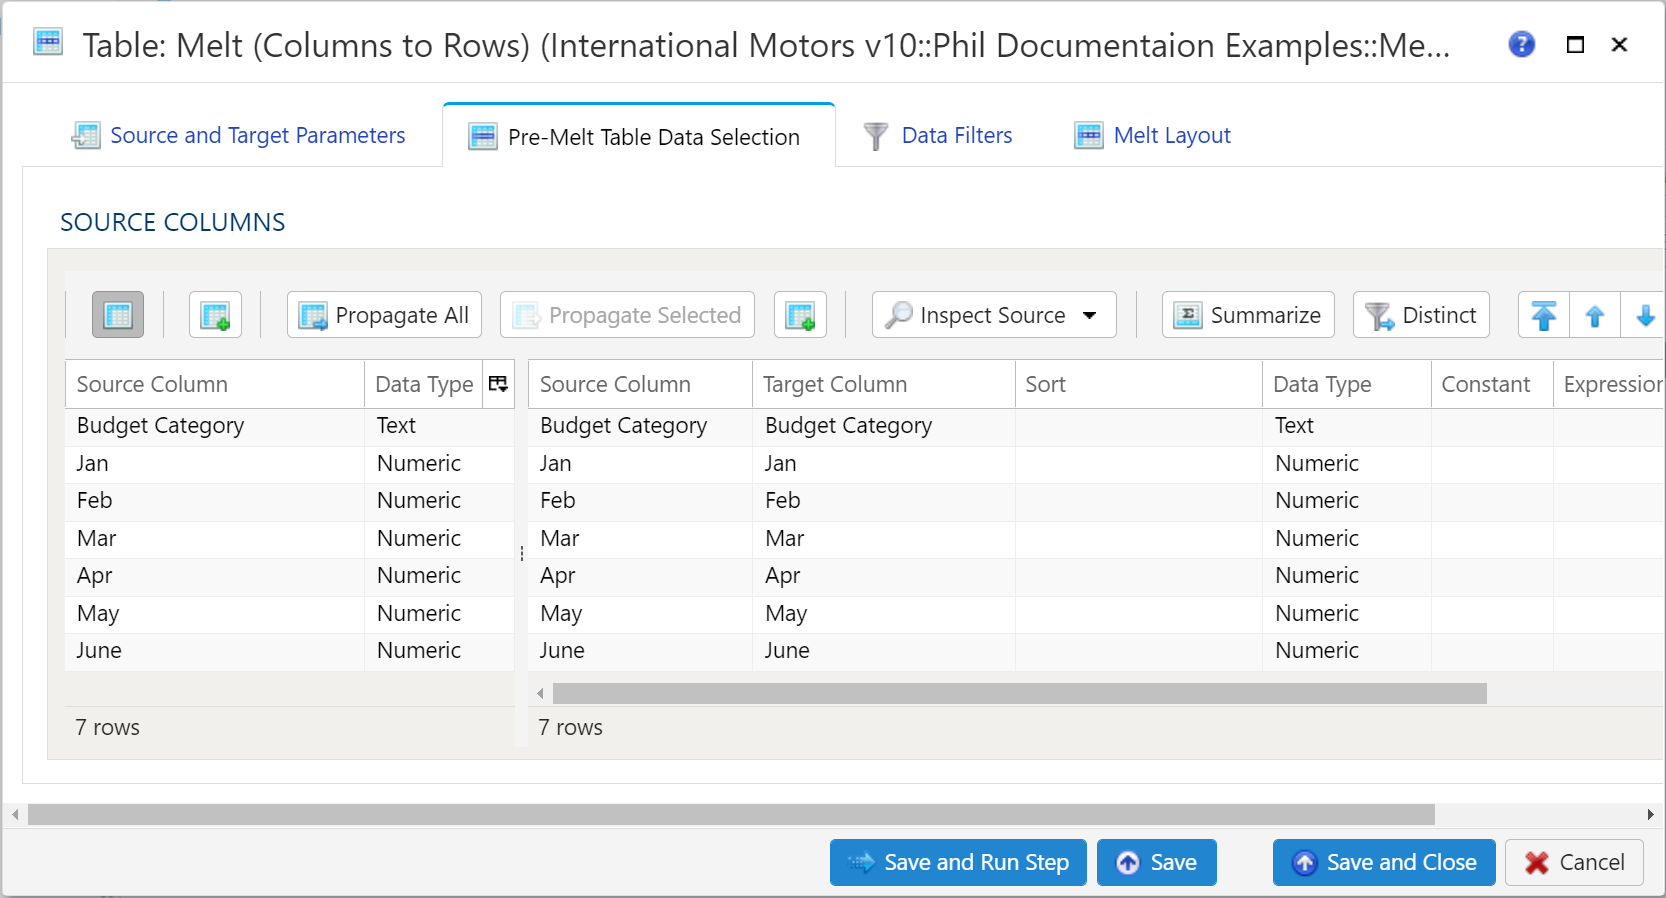
This section is a bit different from the standard Table Data Selection. Basically this is used to specify which columns are to be used in the Melt operation. This includes ID columns and Variable/Value columns.
For more details regarding Table Data Selection, see details here: Table Data Selection
Data Filters
To allow for maximum flexibility, data filters are available on the source data and the target data. For larger data sets, it can be especially beneficial to filter out rows on the source so the remaining operations are performed on a smaller data set.
Select Subset of Source Data
Any valid Python expression is acceptable to subset the data. Please see Expressions
for more details and examples.
Apply Secondary Filter To Result Data
Any valid Python expression is acceptable to subset the data. Please see Expressions for more details and examples
Final Data Table Slicing (Limit)
To limit the data, simply check the Apply Row Slicer box and then specify the following:
- Initial Rows to Skip: Rows of data to skip (column header row is not included in count)
- End at Row: Last row of data to include. This is different from simply counting rows at the end to drop
Melt Layout
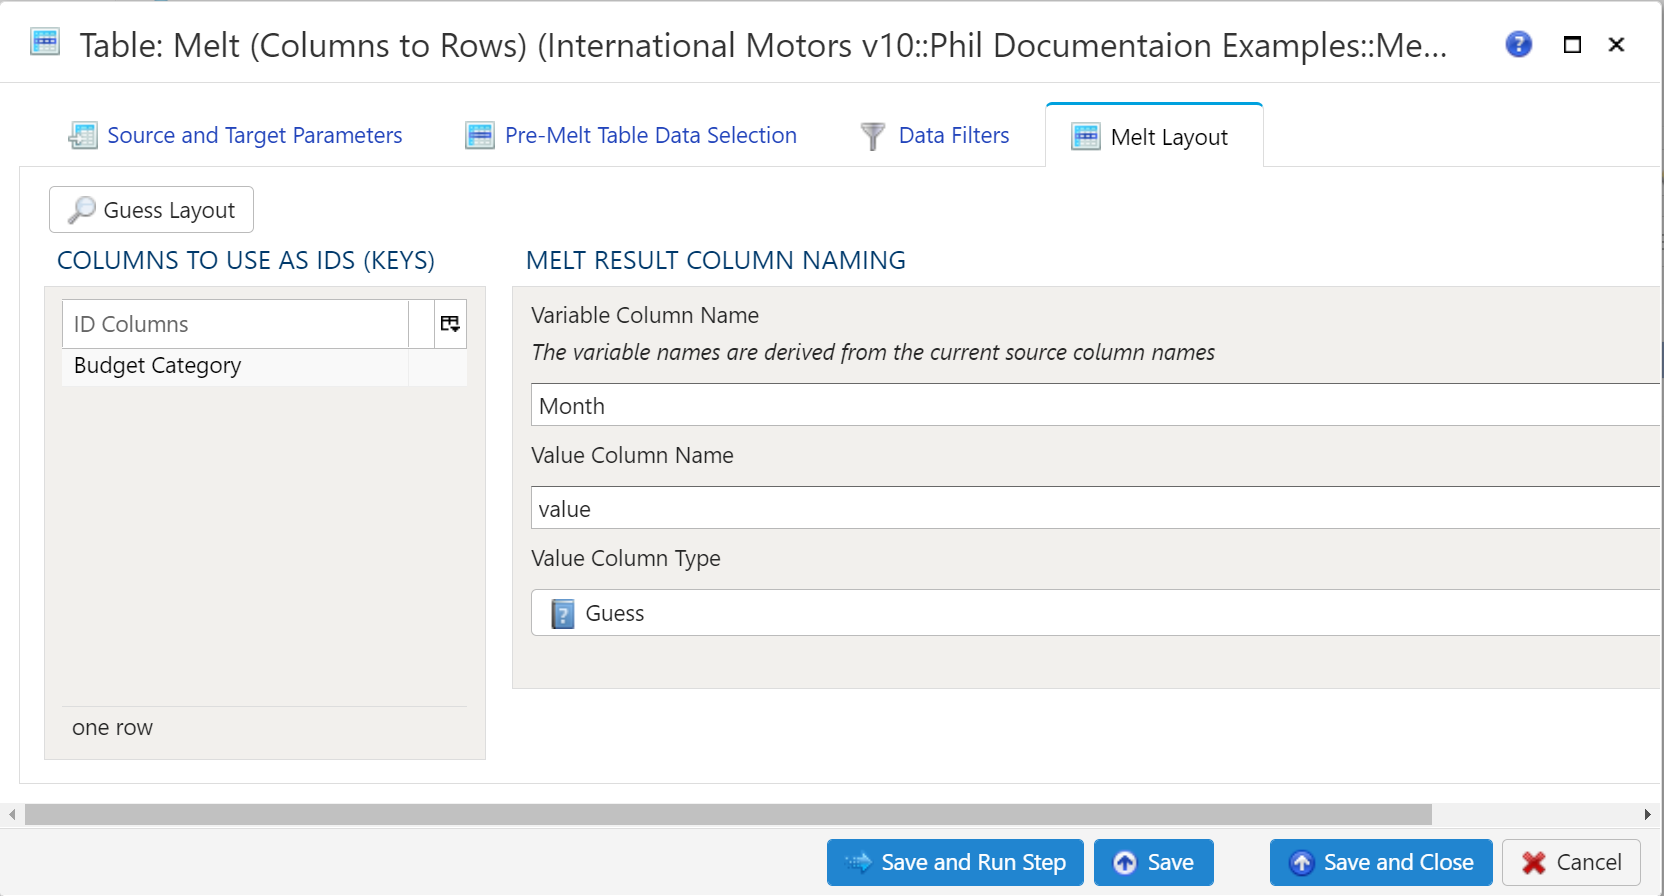
There is a Guess Layout button available to allow Analyze a first crack at specifying ID columns. By default, all text (data type of String) columns are placed in the Keys section. Numeric columns are not placed into Keys by default, but they are allowed to be there based on the model’s needs.
Columns to Use as IDs (Keys)
ID columns are the columns which remain in tact. These columns are effectively repeated for every instance of a variable/value combination. For a monthly table, this would result in 12 repetitions of ID columns.
ID columns can be added automatically or manually. To add the columns automatically, use the aforementioned Guess Layout button. To add additional columns manually, right click anywhere in the section and select either Insert Row or Append Row, to add a row prior to the currently selected row or to add a row at the end, respectively. Then, type the column name to use as an ID.
To remove a field from the IDs, simply right-click and select Delete.
Melt Result Column Naming
There are 2 values to specify. Both of these values will become column names in the target data table.
- Variable Column Name: As specified in the transform, The variable names are derived from the current source column names. Essentially, specify a column name which will represent the data originally represented in the source data table columns.
- Value Column Name: Specify a column name to represent the data represented within the source data table. Typically this will be a numerical unit: Dollars, Pounds, Degrees, Percent, etc.
Examples
In the abouve documentation.